|
by Alex Perkins
Every year, our department hosts a graduate recruitment weekend, during which we bring in 50-60 prospective grad students for an on-campus visit and interview. There are a variety of activities scheduled over the course of this 48-hour period, with one of the most important being one-on-one interviews of prospective students by faculty members. With 50-60 students and 30+ faculty members, scheduling 30-minute interviews in a 3 hour 30 minute window is always a challenging task. When it was my turn to get involved in this scheduling process, I decided that there surely had to be a better way to do this than by hand. To try to come up with a tool that would make this job easier for me and those who come after me, I wrote an R script to automate this process. Here, I describe how that algorithm works and note some observations made along the way. Note: To make this description more vivid, I made some mock inputs based loosely on inputs that were actually used in our interview scheduling process. For fun and in the interest of anonymization, I’ve replaced student names with those of All-American Notre Dame football players, faculty names with those of characters from popular movie franchises categorized by admissions group, and research areas by oddball “-ologies.” Note that gender of characters does not necessarily correspond to gender of faculty members, and whether a character is a hero or villain was chosen arbitrarily and does not reflect my opinion about anyone! Inputs
Like any algorithm, the quality of the inputs is crucial to the quality of the schedule this algorithm generates. One of the most important inputs is a set of requests by individual faculty to meet with certain students. In addition, we have suggestions from faculty about meetings that would be good but are not crucial. Another important input is a list of preferences for certain faculty members indicated by students in their admissions applications. Other inputs include research areas indicated by both faculty (on the departmental website) and students (in their applications), as well as GSAC group affiliations of faculty and students. GSAC is our graduate student admissions committee, which consists of five faculty members who represent themselves and other faculty in department-level discussions and decisions about graduate admissions.
Other inputs to the algorithm are related to constraints on what can be scheduled. The biggest one is if certain faculty members are not available during some time slots. Another is if a very small number of faculty request one-hour meetings with students, which happens occasionally when faculty admit students directly into their lab (i.e., no rotations) and work on research that is highly specialized and non-overlapping with other labs. 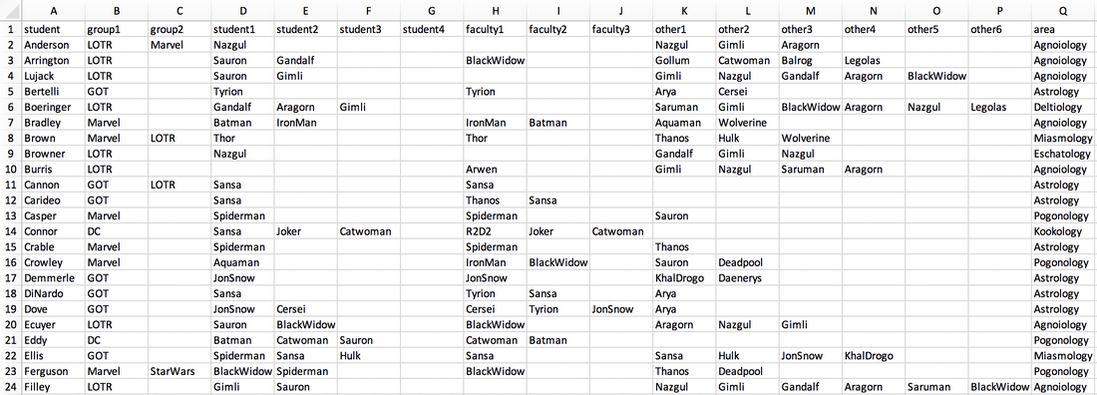
Inputs to the scheduling algorithm. The “group” variables refer to GSAC group affiliation, the “student” variables come from expressions of interest in faculty in student applications, the “faculty” variables come from specific requests by faculty to meet with a student, and the “other” variables come from suggestions by faculty for meetings that are recommended but not required. The area column indicates the research area identified by the student in their application, which maps onto research areas with which faculty identify on our departmental website.
Pre-processing
Other than assembling the inputs in the right format, there is only one other step that is done by hand: deciding what times each student has a meeting. This is done arbitrarily but with the goals of spreading the meeting times out somewhat, making sure that all students get about the same number of meetings, and making sure that every faculty member is in a meeting during a time slot when they are available. Although this step could probably be automated somehow, I have found it easy enough to just do by hand.
Deciding who meets with whom and when
This is the hard part.
The first step involves the construction of an affinity matrix, which describes the strength of the match between each individual faculty member and student. It is constructed by adding points for matches in terms of each of several inputs.
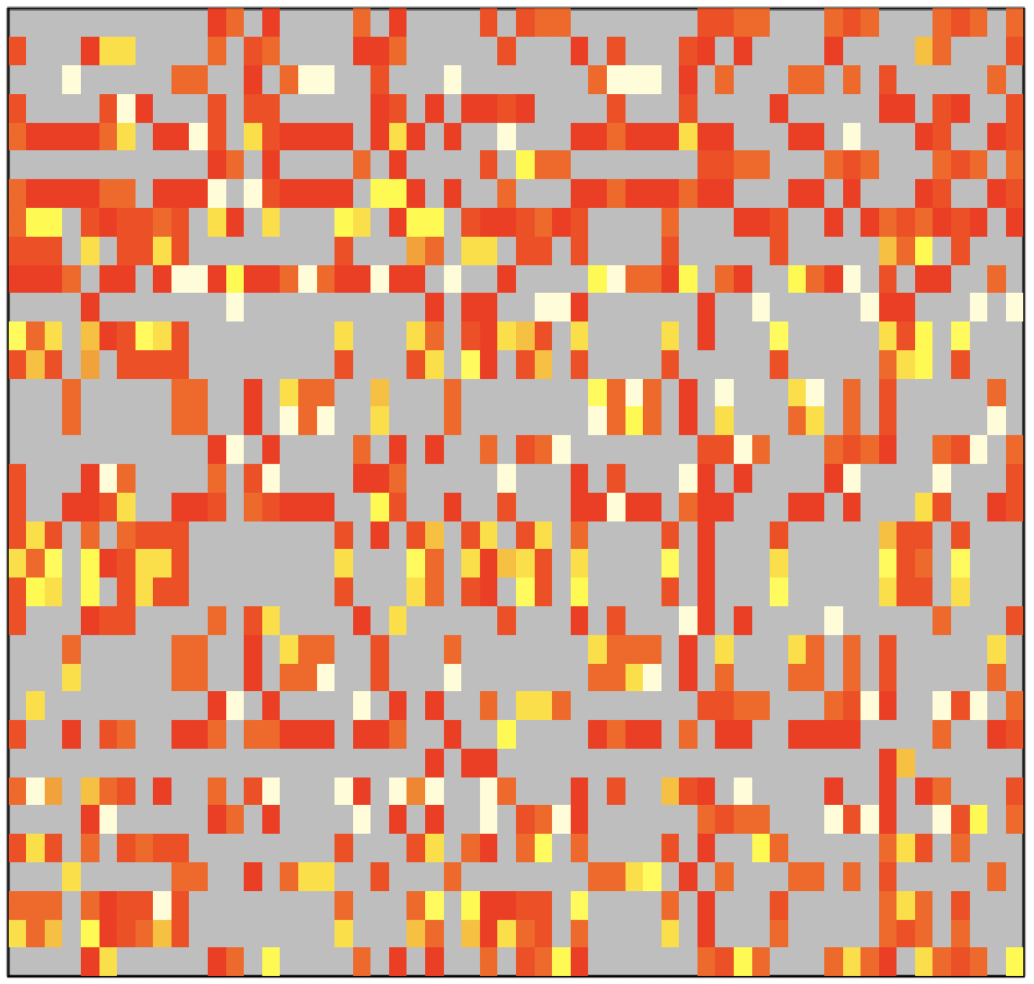
Affinity matrix used to describe the strength of matches between faculty and students. Affinity from high to low is colored white, yellow, orange, and red. Gray indicates an affinity of zero, meaning that the faculty and student do not have any overlapping research interests.
The next step is filling the schedule. Any hour-long meetings are hard-coded into the schedule first. Then, for an arbitrarily chosen time slot, the affinities of all pairings involving students meeting at that time are looked up. Meetings are then set in order of the highest affinities among available faculty-student pairings. When there are multiple pairings that all have affinities equal to the current maximum affinity, a single pairing is chosen randomly from that set. Once a meeting is set, it and all other pairings involving that faculty member and student are removed from consideration during that time slot. Meetings between that faculty member and student are also disallowed during other time slots. Once all meetings during that time slot have been set, the algorithm moves on to another time slot and repeats this process.
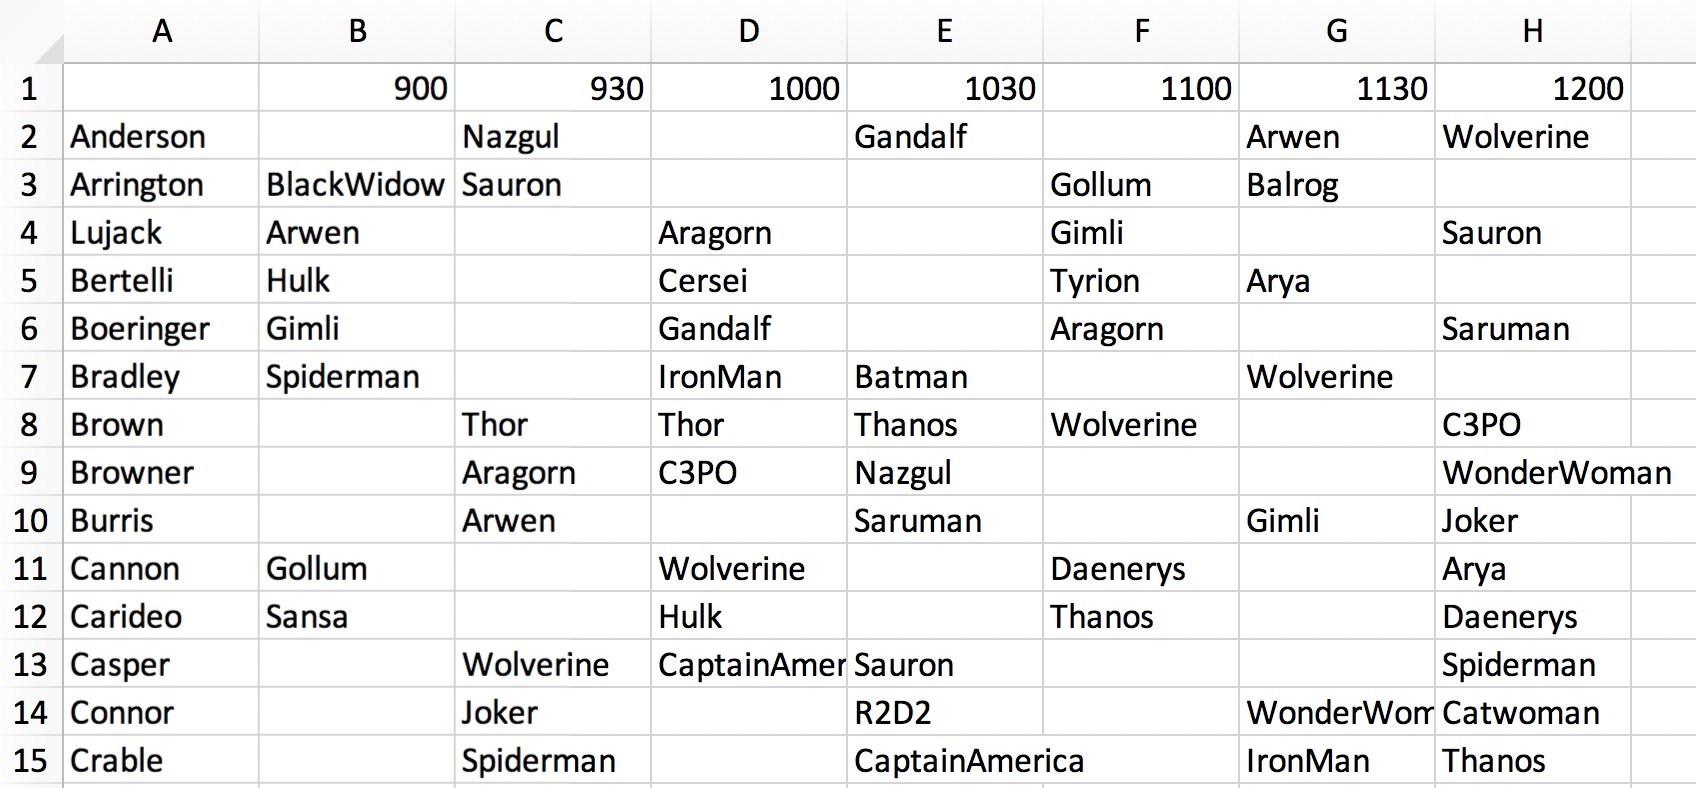
Example schedule generated by the algorithm. Schedules from the faculty perspective are also generated. A separate script not described here was developed by Stuart Jones to convert these spreadsheets into more esthetically pleasing, individualized schedules for each student and faculty member.
Dealing with constraints
There are a number of hard constraints in the algorithm. One that is set a priori is which faculty are available during each time slot. If fewer faculty are available during a time slot, then there are fewer options for which meetings can take place. Furthermore, faculty-student pairings already set during another time slot cannot take place during a subsequent time slot, even if their occurrence in that subsequent time slot might be better in some way (e.g., freeing up time for some other meeting that would not otherwise occur). As mentioned previously, pairings available at the same time can have equal affinities, yet one must be chosen first. If two or more of those pairings involve the same faculty member or student, which of those pairings get chosen will have implications for which meetings can occur in that or subsequent time slots. Last, which students happen to have meetings during a given time slot affects which meetings can or cannot take place.
The fact that there are so many of these constraints and that they are so sensitive to arbitrary choices about ordering makes this problem a prime candidate for automation. Why? While it would be possible (although tedious) to implement this algorithm by hand, doing so would involve numerous arbitrary decisions about ordering. Because it is so hard to make guesses about all the downstream consequences associated with each arbitrary choice, it would be difficult to know whether an optimal choice is being made. The beauty of automating this process is that we can easily perform it repeatedly, trying out thousands of sequences of those arbitrary choices in a matter of a few minutes and choosing only the best one in the end.
The beauty of automation. Rather than perform a tedious task once by hand, automation allows for many instances of this procedure to be performed very rapidly.
Choosing the best
After generating thousands of different schedules based on thousands of different sequences of arbitrary choices, how do we decide which schedule we actually want to use? There are a few different ways I looked into scoring each of the thousands of possible schedules.
The first was to add up the affinities of all the meetings and select the schedule with the largest of these sums. One concern I had about going with this way of scoring is that it was unclear where the high total affinity was coming from. Lots of good but not great meetings? A few really great meetings at the expense of many that are a poor fit? Something else? The second was to calculate the proportion of meetings between faculty members and students with an affinity of zero and try to minimize how many of those take place. While I do think that is something we would like to try to minimize, it appeared that choosing a schedule based on this criterion resulted in some really important meetings not taking place. The third was to calculate the proportion of meetings requested by faculty members and try to maximize how many of those take place. In the event that our schedule does not include meetings specifically requested by faculty, we are going to get complaints and have to make adjustments by hand after the schedule has been drafted. In the end, I went with this option and afterwards performed adjustments by hand to meetings that were a poor fit. How well did the algorithm perform?
It is difficult to know whether we have arrived at an optimal schedule in the sense that there is no other possible schedule that is better than the one we select. And as mentioned previously, there are different criteria by which to evaluate how good a schedule is, with an optimal schedule in one sense likely being suboptimal in some other sense. Also very importantly, if there are shortcomings in the inputs used or the way in which the algorithm makes decisions, then it might be possible for a schedule to be devised by hand that would be perceived to be better by human judgement.
With all those caveats in mind, I calculated the proportion of meetings of different types in each of 10,000 replicate schedules that were generated by the algorithm. These are shown by the colored distributions below. Within each of those colored distributions, the black arrow indicates the performance of the one schedule that was chosen in the end on the basis of maximizing the number of meetings that faculty specifically requested. As a point of comparison, I reran the algorithm with a completely flat, uninformative affinity matrix to generate a comparable null distribution, which is shown in gray. 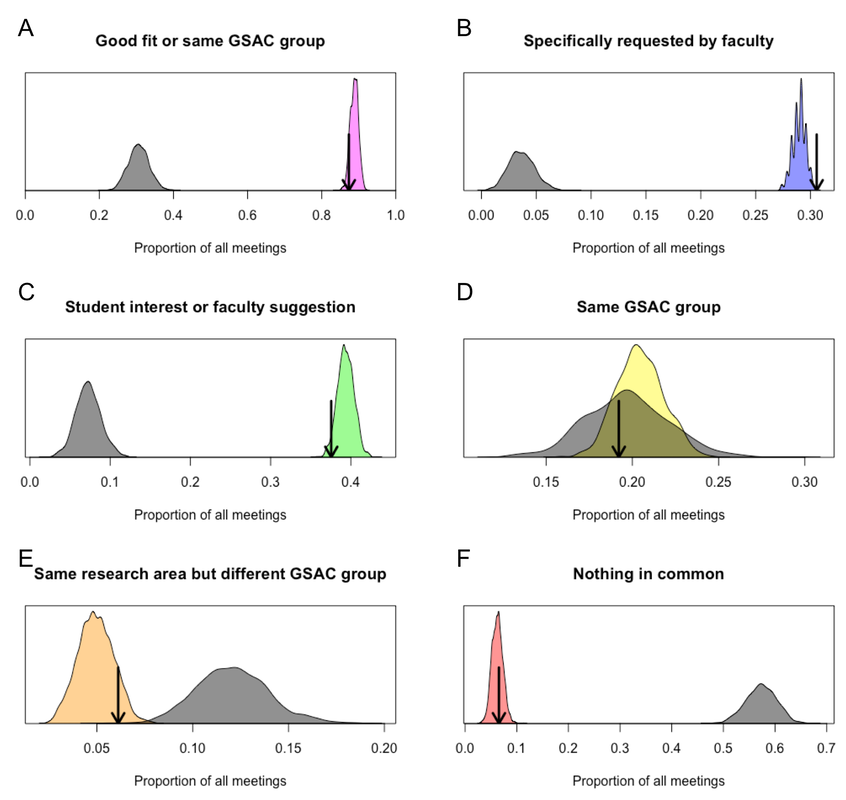
Performance of the scheduling algorithm. Performance was assessed in terms of the proportion of meetings falling into different categories shown in each panel. A single schedule that we actually used was chosen based on the criterion in B.
Compared to the null distribution, the algorithm led to the greatest improvement in the proportion of meetings that satisfied specific requests by faculty. This is no surprise given that these meetings were prioritized most heavily in the affinity matrix. The algorithm also performed very well in making meetings happen between students and faculty that they expressed interest in, as well as meetings that faculty thought would be good but were not strictly required. Meetings between students and other faculty in the same GSAC group occurred at frequencies similar to the null distribution. Meetings with faculty outside of a student’s GSAC group occurred about 10% of the time, with about half of those at least being with faculty with a shared interest in some broad research area. Last, whereas random matching would have resulted in nearly 60% of meetings being between students and faculty with no common research interests, the algorithm reduced that proportion by around ten-fold.
Was creating this algorithm worth the trouble?
Although developing this algorithm certainly took some time, I found that time to be much more enjoyable and rewarding than if I had done this task by hand.
Now that this algorithm has been developed, I feel reasonably assured that we are getting about as good of a schedule as we can given various constraints. Had I done this by hand, I think I would have had more doubts about whether I could have done a better job, just because doing it by hand doesn’t provide a straightforward way to compare among alternatives. Another benefit of this algorithm has been the ability to refine inputs and quickly generate a new schedule. Upon reviewing a first draft of the schedule, Siyuan Zhang noted a number of poor matches among faculty and students outside my area of research. He was then able to make some suggestions about students and faculty who would be better matches, which I was able to use to quickly generate a new schedule that resolved a lot of the problems with the first version. This second version was certainly not perfect, but the problems with it were fairly isolated and relatively easy to address by hand. This is the second year that I have used this algorithm. It was certainly much easier to brush up on the code and rerun on new inputs than it was to write it from scratch last year. I also made a few updates, which led to some improvements in performance. Next year, I anticipate that this process will be even easier. The more years we end up using this algorithm, the greater the benefits of this investment in automation will be. |
